A family cross-shopping El Cajon against La Mesa this fall keeps running into the same problem. El Cajon's median price per square foot sits in the high $400s. La Mesa's sits in the mid $500s. The instinct is to read that as an $80 to $100 gap between two cities, then decide which city fits the budget.
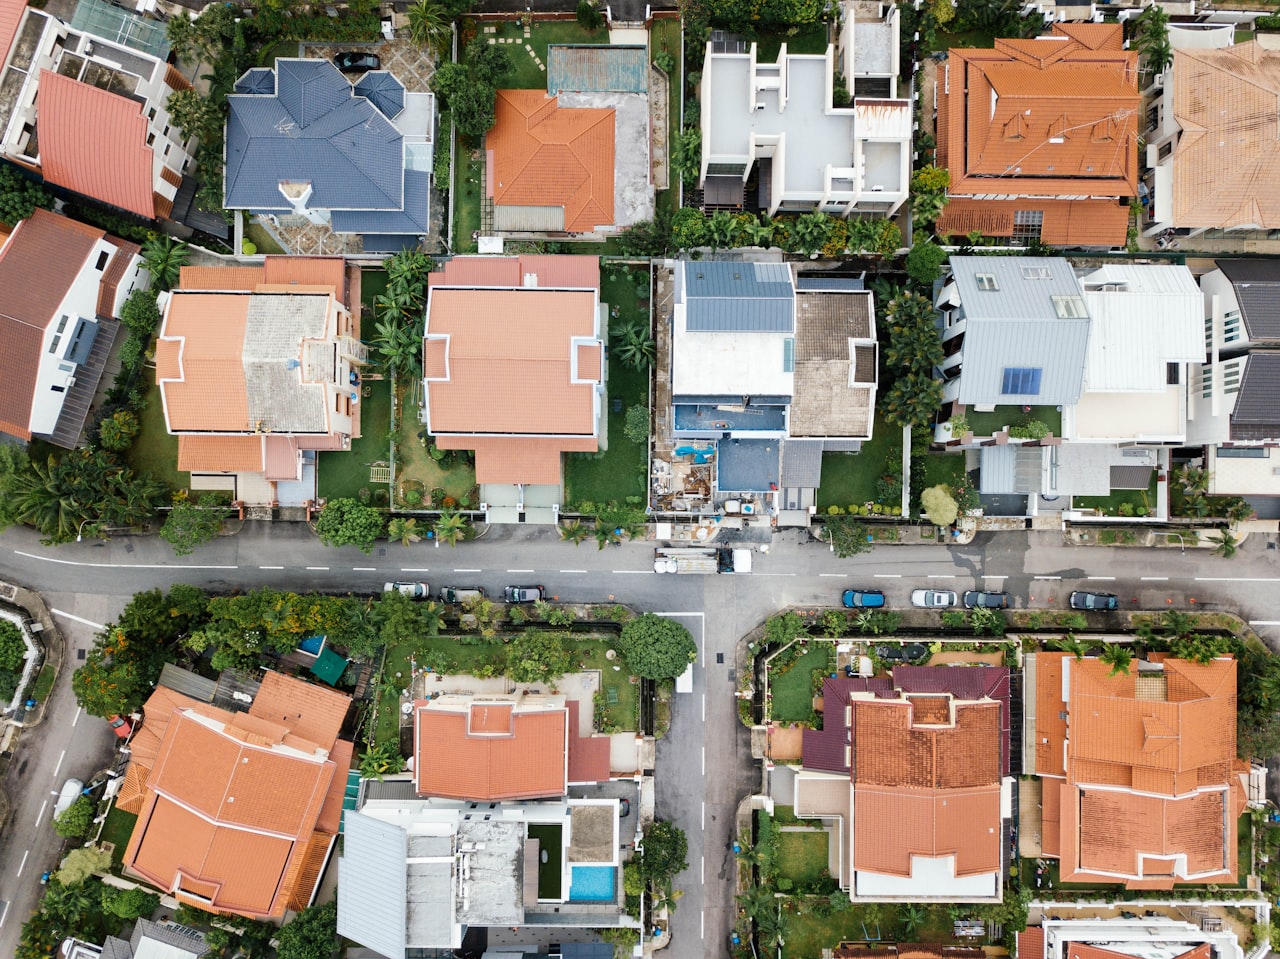
That instinct undercounts the real spread by more than half. Inside La Mesa's own city limits, homes in Mount Helix sold for a median $494 per square foot as of July 2026, down 14 percent year over year. In the same reporting window, homes in Fletcher Hills, a few minutes away, sold for a median $656 per square foot, up 23 percent year over year, on a median sale price of $838,000. That's a $162 spread inside one city, wider than the entire gap most buyers think they're seeing between El Cajon and La Mesa.
The Same City, Two Different Markets
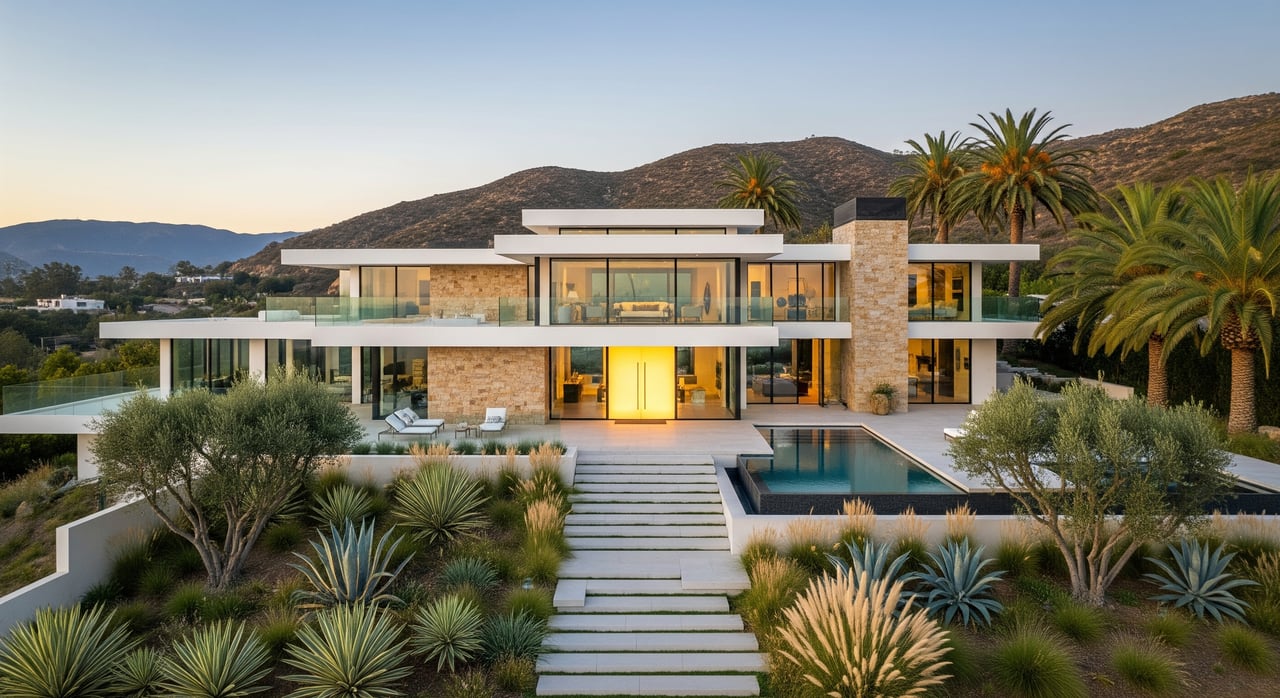
The mechanism here isn't mysterious once you see it. A larger home on a hillside or view lot carries a lower price per square foot even at a comparable total sale price, because a meaningful share of what the buyer is paying for is land and outlook rather than interior space. A smaller, well-kept home near strong school access does the opposite: the total price stays moderate, but because there's less square footage to divide it by, the per-square-foot number climbs. Two homes can sell for close to the same dollar figure and still produce wildly different per-square-foot math, purely because of how much house that dollar figure is spread across.
| Area | Median $/sqft | Window | YoY change | Median sale price |
|---|---|---|---|---|
| La Mesa (citywide) | $560 | 3 months ending May 2026 | down 2.7% | $886,000 |
| Mount Helix | $494 | as of July 2026 | down 14.2% | — |
| Fletcher Hills | $656 | recent reporting period | up 23.1% | $838,000 |
The citywide La Mesa number isn't wrong. It's just an average of two markets that don't behave the same way, and a buyer who anchors on it will be surprised in either direction depending on which side of the city they end up touring.
What El Cajon's Own Number Is Hiding
El Cajon looks like the simpler comparison because its citywide figure has less obvious internal split reported. Over the three months ending in May 2026, El Cajon's median sale price per square foot ran $477, down 4.5 percent from the same window a year earlier, on a citywide median sale price of $712,000. A separate six-month tracking window through August 2026 put El Cajon's median closed price at $730,750, with the middle half of all sales falling between $494,000 and $860,000, and price per square foot across that same window ranging from $414 to $584.
That range matters more than the single headline figure. A buyer targeting the bottom half of El Cajon's market and a buyer targeting the top half are shopping in markets that overlap with La Mesa's Mount Helix on one end and brush up against Fletcher Hills pricing on the other. The city label tells you less than the specific block.
Rancho San Diego's Number Is a Trap for a Different Reason
Rancho San Diego, the sub-area inside El Cajon that shows up in a lot of school-and-retail comparisons, has its own price-per-square-foot figure: $531, up 6.4 percent year over year. The most recent widely published snapshot behind that number is dated July 2025, already well over a year old as of this fall, and it covered just 21 closed sales for the entire month, up from only 12 the year before.
That's not a market with a stable monthly median. That's a market where one custom home on a large lot, or one distressed sale, can swing the reported number by tens of dollars per square foot in either direction. El Cajon's citywide figure draws on roughly 150 to 165 monthly closings. La Mesa's draws on well over 100. Rancho San Diego's headline number is built on a fraction of that volume, which is exactly why it can look stale, look volatile, or both at once. Treat it as a rough signal, not a live benchmark, until you're looking at actual closed comps on the specific street.
The Rest of East County, for Scale
Zooming out past the three-way comparison, the rest of East County's submarkets each carry their own per-square-foot figure and their own caveats about what kind of price that figure reflects.
| Area | $/sqft | Window | Basis |
|---|---|---|---|
| Lakeside | $435 | September 2026 | list price |
| Spring Valley | $479 | Q2 2026 | sale price |
| Jamul | $429 | June 2026 | list price |
| Eastern San Diego (city neighborhood) | $647 | 3 months ending May 2026 | sale price |
| San Diego (citywide) | $687 | 3 months ending Aug 2026 | sale price |
Lakeside and Jamul's figures are built from list prices, not closed sales, so they run a step ahead of what actually clears escrow. Spring Valley's sale-price figure, drawn from a second-quarter 2026 window, sat close to flat year over year. Eastern San Diego, a separate neighborhood classification inside the City of San Diego itself rather than a part of El Cajon or La Mesa, priced well above either city's own citywide number over that same spring window, a reminder that "east of downtown" and "East County" aren't the same geography even when they sound like it. Set next to San Diego's citywide $687 per square foot, every true East County submarket here still reads as the more affordable side of the county, which is the broader story underneath all of this local variance.
The Discount Everyone's Watching, and Why It Might Not Last
Local market commentary this year has pointed to a gap of roughly $250,000 to $400,000 between El Cajon list prices and comparable homes in La Mesa, framing that gap as the reason families priced out of the trolley corridor are increasingly looking east instead. The same commentary flagged Rancho San Diego and Fletcher Hills specifically as the sub-areas buyers cross-shopping the whole stretch tend to circle first, citing school access and newer retail nearby.
Grossmont Center's mixed-use phase is scheduled to open sometime across 2026 and 2027, which would close at least part of the retail gap that currently separates El Cajon's commercial core from La Mesa's. Whether that's enough to move El Cajon's median toward La Mesa's isn't visible in the numbers yet. It's the kind of catalyst worth watching if you're timing a purchase, or a listing, over the next year rather than reacting to it after the fact.
What This Means If You're Actually Comparing These Three Areas
If you're cross-shopping El Cajon, La Mesa, and Rancho San Diego, the citywide median is the wrong unit of comparison. The right question isn't "which city is cheaper." It's "which specific streets, in which specific sub-area, and how many closed sales actually built that number." Ask for the six-month range the way El Cajon's own tracking exposes it, not just the single median. A $414 to $584 per square foot band tells you more about what an 1,800 square foot home will actually cost than a headline $477 figure ever will.
Buyers who skip that step end up comparing a thin, volatile number from one sub-area against a thick, stable number from a full city, and walking away with a completely wrong sense of where the real bargain is.
If you're weighing a move across El Cajon, La Mesa, or Rancho San Diego and want the comps that actually match your target block rather than the citywide average, Lyle & Grace can pull the closed sales for the specific streets you're considering before you make an offer based on a number that was never built for your comparison in the first place.